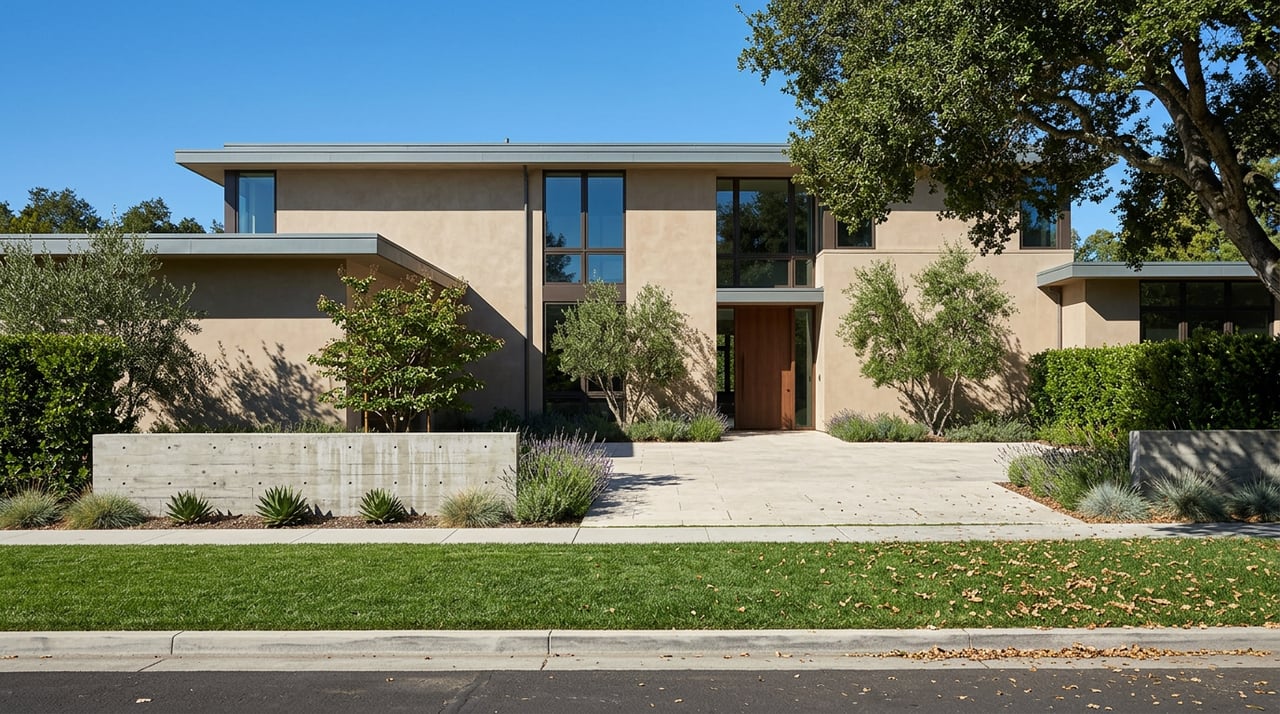
Two people search "homes for sale in Thousand Oaks" this week. One is looking in Los Robles. One is looking in Lynn Ranch, on the western side of the city. Both are technically buying in the same city, at the same time, in the same market. The homes they're looking at differ in price. Neither of them is wrong about what Thousand Oaks costs. They're just asking about two different Thousand Oaks.
That's the problem with the number everyone quotes. As of the three months ending May 2026, the median sale price across Thousand Oaks sits at $1.1 million, down 1.3 percent from a year earlier, with a median price per square foot of $535, down 3.4 percent. Those numbers are accurate. They're also close to meaningless for anyone trying to figure out what their own search should actually cost, because the city's median is a blend of neighborhoods that don't compete with each other, don't share a housing stock, and in some cases don't even share a zoning designation.
One City Name, Several Different Markets
Thousand Oaks stretches from equestrian-zoned hillside parcels on its western edge to condo-dense pockets near its original downtown core, with master-planned tracts and country-club-adjacent enclaves filling in between. Pull current listing data by neighborhood and the spread becomes obvious fast.
| Area | Typical price point, current as of late August 2026 | Character |
|---|---|---|
| Los Robles | $704,900 | Smaller detached and attached homes |
| Central Thousand Oaks | $822,500 | Condo and townhome heavy, closer to the original downtown |
| Newbury Park | $1,065,000 | Includes Dos Vientos Ranch, a master-planned community |
| Wildwood | $1,067,141 | Established, sits near the hills and open space around Wildwood Regional Park |
| Sunset Hills | $1,019,995 | Established hillside tract |
| Lang Ranch | $1,290,000 | Planned community, more uniform product |
| Rancho Conejo Village | $1,390,000 | Larger single-family lots |
| Westlake Village (Thousand Oaks side) | $1,399,999 | Distinct from the neighboring city of the same name |
| North Ranch | $1,399,000 | Golf-adjacent, larger custom homes |
| Lynn Ranch | $1,597,500 | Larger lots, equestrian character, on the western side of the city |
That's nearly a $900,000 gap between the least and most expensive named area on this list, inside one city, in the same month. Conejo Oaks and Casa Conejo don't even show up on the Redfin sidebar list above because they're smaller pockets, but they follow the same pattern: Conejo Oaks is known locally for its larger residential lots and sits toward the middle of the range, while Casa Conejo, Oaknoll Villas, Village Green, and Las Flores Villas function as some of the more attainable entry points in the city, the communities buyers get pointed to when a $1.1 million median feels out of reach.
None of this is a story about better or worse neighborhoods. It's a story about the citywide median being a mathematical average of markets that were never meant to be averaged together.
The Central Thousand Oaks Contradiction
Here's where the number gets genuinely strange, and where a buyer or seller relying on the median alone can get a materially wrong read on value.
In Central Thousand Oaks specifically, the median sale price over the three months ending May 2026 was $854,000, down 11.5 percent from the same period a year earlier. Read on its own, that sounds like a neighborhood losing value fast. But the median price per square foot in that same neighborhood, over that same window, was $571, up 20.6 percent year over year.
A falling median price and a rising price per square foot in the same neighborhood at the same time isn't a contradiction once you understand what's actually selling. It means the mix of homes that closed escrow shifted toward smaller units, not that the value of any individual home dropped. A smaller condo selling at a higher rate per square foot than last year's larger detached homes will still produce a lower median sale price, even though the market for comparable homes tightened.
This matters most for sellers. If you own a detached single-family home in Central Thousand Oaks and you see headlines about an 11.5 percent decline, you might price defensively, assuming buyers have pulled back. The per-square-foot number tells a different story: demand for what you own may be stronger than the median suggests, because the median is being dragged down by a change in what category of home is trading, not by weaker demand across the board.
Two Speeds, One City
The price convergence across sources is actually reassuring. Redfin puts the citywide median at $1.1 million. Zillow's home value index has the average at $1,052,875 as of the end of June 2026, up half a percent year over year. Movoto recorded a median sold price of $1,075,000 in June 2026. Three different measurement methods land within roughly $50,000 of each other, which is about as close to agreement as you get in residential data.
Where those sources split is speed. Zillow shows homes going to pending in around 17 days. Redfin and Movoto both put the median time on market closer to 37 to 40 days, with Redfin specifically noting homes sold after 40 days in the three months ending May 2026, up from 36 days the year before.
That gap between 17 days and 40 days isn't a data error. It's two different segments of the same market moving at two different speeds. The fastest-moving homes, the well-priced, well-prepared listings in the areas buyers already understand, are pending in about two and a half weeks. Everything else, including homes priced against last year's comps or sitting in a category buyers are more hesitant about right now, is dragging the median out closer to six weeks.
If you're selling, the 17-day market is the one you want to be in, and getting there has less to do with the neighborhood you're in than with whether your price reflects which version of Thousand Oaks you're actually competing against.
What Actually Drives the Spread
Four structural factors explain most of the gap between the cheapest and most expensive named areas in this city, and none of them are simply "location is better here than there."
Lot size and zoning do more work than most buyers expect. Lynn Ranch and Conejo Oaks carry a reputation for larger parcels, and in Lynn Ranch's case, an equestrian character that supports keeping horses on the property. That kind of usable land is scarce and doesn't get built anymore at any price point, which is a large part of why Lynn Ranch sits at the top of the current list price range.
Housing stock composition explains the Central Thousand Oaks and Los Robles numbers. Both areas carry a higher share of condos, townhomes, and older, smaller single-family homes. A neighborhood's median moves with what's actually built there, and a city built mostly of larger detached homes will always report a higher number than one with more attached product, independent of how desirable either area is to live in.
Proximity to protected open space shows up in Wildwood's numbers. The neighborhood backs to Wildwood Regional Park, and its median sale price was essentially flat year over year, up 0.4 percent, while the broader city median slipped. Established neighborhoods next to permanent open space tend to hold their footing even when the citywide number softens, because that adjacency doesn't get built again.
Planned-community uniformity explains the middle tier. Lang Ranch and Dos Vientos Ranch in Newbury Park were built as cohesive tracts with more consistent lot sizes and architectural styles. That consistency tends to produce a tighter, more predictable price band than older, more organically developed areas where lot size and home age vary block to block.
What This Means If You're Comparing Neighborhoods
If you're using the citywide median to decide whether Thousand Oaks fits your budget, you're asking the wrong question. The more useful question is which of these four categories your search actually belongs to: larger-lot and equestrian character, attached and entry-level stock, open-space-adjacent established neighborhoods, or planned-community uniformity. Once you know which category you're shopping in, the number that matters is that category's number, not the blended citywide figure.
The same logic applies in reverse for sellers. Before you price against "the Thousand Oaks median," find out what homes structurally similar to yours, in a neighborhood with a similar lot profile and housing stock, have actually closed at recently. The citywide number was never describing your house. It was describing all of them at once.
A few questions worth asking before you set a number
Is the neighborhood median or the citywide median more useful for pricing my home? The neighborhood-level number, almost always. The citywide figure is useful context for understanding the broader trend, but pricing a specific home against a blended average across nine or more structurally different sub-markets will consistently mislead you in one direction or the other.
Why did my neighborhood's price per square foot rise while the median sale price fell? This usually means the mix of homes that sold changed, not that values dropped. Smaller or older units trading at a higher rate per square foot can pull the median sale price down even as underlying values hold or climb.
Does a 17-day pending time mean I should expect a fast sale? Only if your home is priced and presented like the listings driving that number. The 17-day figure reflects the fastest-moving segment of the market. The 40-day figure reflects the median across all listings, including ones that started overpriced and had to adjust.
If you're trying to figure out which version of Thousand Oaks your search or your sale actually belongs to, that's exactly the kind of neighborhood-level read the Shari Schiff Team works through with clients across the Conejo Valley every week. Request your complimentary home valuation and get a number based on what's actually comparable to your home, not a citywide average that was never describing it in the first place.
This article is general information, not legal, tax or financial advice. Consult a qualified professional about your situation.